

You left off the Antarctic Sea Ice chart for some reason....? And I like my "cut and paste" version of the 5 steps better, although I did edit it in an attempt at brevity. Regards


For Those That Love Science... An Interesting Read
Started by
The Average Joe
, Dec 11 2015 06:24 PM
106 replies to this topic
#76

Chris
-

- Premium Member
-

- 7,857 posts
Hopeless Addict
- Location:Folsom CA
Posted 02 January 2016 - 08:47 AM
1A - 2A = -1A
#77
apeman45
-

- Premium Member
-
- 191 posts
Veteran
- Gender:Male
Posted 02 January 2016 - 01:56 PM
You did do some nice edits!
Regards and Happy New Year!
#78
Chris
-
- Premium Member
-
- 7,857 posts
Hopeless Addict
- Location:Folsom CA
Posted 02 January 2016 - 05:38 PM
You did do some nice edits!
Regards and Happy New Year!
I did...! I did...! Cut out all those bad links and anti Catholic stuff that was in there for some reason....?
And from one Geologist to another, Happy New Year to you Sir....!
And check this chart out, I think there is an ice conspiracy, somebody is moving ice from the Arctic to the Antarctic...... Putin, ISIS, Al Gore, the Mafia, Taylor Swift, Hillary Clinton, the vast right wing conspiracy, the NSA, or Spectre, not really sure who is behind it....? Something evil is going on, to move all that ice from the top of the planet to the bottom and think we would not notice.....? Regards, Chris

1A - 2A = -1A
#79
The Average Joe
-
- Premium Member
-
- 7,155 posts
Hopeless Addict
Posted 02 January 2016 - 09:09 PM
Yeah, with all the talk about the arctic, no one ever mentions that the Antarctic has 90% (and growing) of the world's ice and 70% of the worlds freshwater locked up. At its thickest,the Antarctic ice cap is 4770 meters deep. Arctic ice on the other hand is a couple meters deep. By volume, it is pretty insignificant. By albedo forcing, probably fairly significant. The cyclical change in the tilt of the Earth and the change in our orbit from circular to slightly ellipsoid would have far more effect.. Our current tilt is 23.44 degrees (decreasing) from a maximum of 24.5 to a minimum of 22.1. More tilt would imply more extremes between winter and summer. At zero axial tilt, there would be no seasons of course.
Add in orbital eccentricity, and you could have a pretty good theory for why the northern pole is warming, while the southern pole is cooling. Remember, in the ice age, the northern hemisphere was most effected.
Orbital mechanics require that the duration of the seasons be proportional to the area of the Earth's orbit swept between the solstices and equinoxes, so when the orbital eccentricity is extreme, the seasons that occur on the far side of the orbit (aphelion) can be substantially longer in duration. Today, northern hemisphere fall and winter occur at closest approach (perihelion), when the earth is moving at its maximum velocity—while the opposite occurs in the southern hemisphere. As a result, in the northern hemisphere, fall and winter are slightly shorter than spring and summer—but in global terms this is balanced with them being longer below the equator. In 2006, the northern hemisphere summer was 4.66 days longer than winter and spring was 2.9 days longer than fall.[11]
"Of all tyrannies, a tyranny sincerely exercised for the good of its victims may be the most oppressive" -- C.S. Lewis
If the only way to combat "global warming" was to lower taxes, we would never hear of the issue again. - Anonymous
"Society in every state is a blessing, but Government, even in its best state, is but a necessary evil; in its worst state an intolerable one" — Thomas Paine, 𝘊𝘰𝘮𝘮𝘰𝘯 𝘚𝘦𝘯𝘴𝘦 (1776)
#80
GrumpyOldGuy
-

- Premium Member
-
- 544 posts
Superstar
- Gender:Male
Posted 03 January 2016 - 08:19 AM
Perhaps I can assist in interpreting the data Joe showed on the above chart.
- The slope of the normalized data for Arctic ice decrease is approx -4.7% per decade. (data from https://nsidc.org/data/seaice_index/ )
- The slope of the normalized data for Antarctic ice increase is approx +0.8% per decade. (data from same source)
- The net change of ice is then -3.9%, but then needs to be normalized for the differences between Artic and Antarctic total sea ice areas.
- When normalized for the area differences, the net sea ice change for Artic and Antarctic taken together is -2.6% per decade.
Global sea ice is decreasing and there could be only two plausible explanations:
1) During transport from north to south, some of the ice is being diverted to margarita machines all over the planet, or
2) The planet is getting warmer.
You decide...
#81
Chris
-
- Premium Member
-
- 7,857 posts
Hopeless Addict
- Location:Folsom CA
Posted 03 January 2016 - 03:06 PM
Perhaps I can assist in interpreting the data Joe showed on the above chart.
- The slope of the normalized data for Arctic ice decrease is approx -4.7% per decade. (data from https://nsidc.org/data/seaice_index/ )
- The slope of the normalized data for Antarctic ice increase is approx +0.8% per decade. (data from same source)
- The net change of ice is then -3.9%, but then needs to be normalized for the differences between Artic and Antarctic total sea ice areas.
- When normalized for the area differences, the net sea ice change for Artic and Antarctic taken together is -2.6% per decade.
Global sea ice is decreasing and there could be only two plausible explanations:
1) During transport from north to south, some of the ice is being diverted to margarita machines all over the planet, or
2) The planet is getting warmer.
You decide...
Margarita's give me nasty headaches and weird dreams..... So it's not me...... And all of your math above means nothing because it is a micro second glimpse in a very long Earth time line, eons, eons, eons of time. Data yes, but you can't draw any conclusions from such a short sampling period. Less ice up top lately, more ice down below lately, that is what the chart and data say....
And maybe the planet is getting warmer (along with the whole solar system maybe too?). I think we are in a warming period of a mini ice age or in between mini ice ages as do many others.
But is it man made or a natural cycle....? Like so many cycles before we existed on Earth and many more to come when we are just fossils in yet another rock layer of the Earth... I say natural Earth, Solar, Sun cycles. No proof from you or anyone else that man has anything to do with it, none at all. Chris
50 million years ago, CO2 at about 500 ppm...
100 million years ago, CO2 at about 1800 ppm....
200 million years ago, CO2 at about 1500 ppm....
300 million years ago, CO2 at about 300 ppm....
400 million years ago, CO2 at about 3500 ppm...
500 million years ago, CO2 at about 4800 ppm....
1A - 2A = -1A
#82
GrumpyOldGuy
-
- Premium Member
-
- 544 posts
Superstar
- Gender:Male
Posted 03 January 2016 - 03:33 PM
Chris, if you refer to a post of mine earlier (27 Dec), you will see that current warming is no part of a natural cycle. The rate of current warming is unprecedented (never happened before). Based on your previous posts, it appears you don't discern the difference between specific temperature magnitude and the rate of change. This is unfortunate, because the important part is the rate. It's clear you won't be convinced about this. But we live in a place where you are free to believe whatever you wish. Have at it...
#83
Chris
-
- Premium Member
-
- 7,857 posts
Hopeless Addict
- Location:Folsom CA
Posted 03 January 2016 - 04:22 PM
Chris, if you refer to a post of mine earlier (27 Dec), you will see that current warming is no part of a natural cycle. The rate of current warming is unprecedented (never happened before). Based on your previous posts, it appears you don't discern the difference between specific temperature magnitude and the rate of change. This is unfortunate, because the important part is the rate. It's clear you won't be convinced about this. But we live in a place where you are free to believe whatever you wish. Have at it...
Rate of change means nothing in a 50 year data set when you are talking eons...... You are stuck in the last 50 years, I'm looking back 500 million years and more... Do some of your "math" on the numbers below and get back to us....... Or you can ignore them again as before..... Chris
50 million years ago, CO2 at about 500 ppm...
100 million years ago, CO2 at about 1800 ppm....
200 million years ago, CO2 at about 1500 ppm....
300 million years ago, CO2 at about 300 ppm....
400 million years ago, CO2 at about 3500 ppm...
500 million years ago, CO2 at about 4800 ppm....
1A - 2A = -1A
#84
The Average Joe
-
- Premium Member
-
- 7,155 posts
Hopeless Addict
Posted 03 January 2016 - 04:41 PM
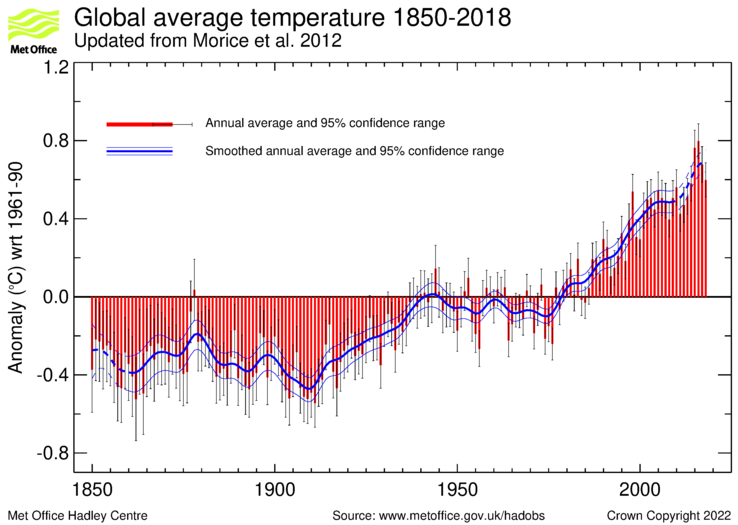
One of the problems with ALL charts and datasets is the period they cover. As Chris pointed out, a very brief time is covered by your chart. It's very important to look at start dates and finish dates for datasets. Changing those can have a HUGE effect on outcomes for averaging, especially for short time scales. For example, if you take the data from 1870 to 1915, it shows a pretty steep cooling trend. If you take a look at other times, there is a steep increase over short timeframes. The increase from 1910 to 1945 is of the same magnitude as our more recent 1975- 2010. Same period of time, same increase. Again, your "unprecedented " claim is simply not true. Also, I gave some quotes from other studies that said that rate of change may have been as much as 1 degree per decade in history. Bottom line, there were no sensors beyond a mere blink of the eye geologically, so we are left with proxies like tree rings, bio evidence and ice cores. Those are handy, but hardly global in nature. Anything beyond a thousand years past is saddled with a huge margin of error, and there is NO WAY to determine if current global temperatures are accelerating faster than ever.
Of course, if you took an even longer timeline, these ups and downs would be minimalized into statistical noise with much larger swings in global temperature.
"Of all tyrannies, a tyranny sincerely exercised for the good of its victims may be the most oppressive" -- C.S. Lewis
If the only way to combat "global warming" was to lower taxes, we would never hear of the issue again. - Anonymous
"Society in every state is a blessing, but Government, even in its best state, is but a necessary evil; in its worst state an intolerable one" — Thomas Paine, 𝘊𝘰𝘮𝘮𝘰𝘯 𝘚𝘦𝘯𝘴𝘦 (1776)
#85
The Average Joe
-
- Premium Member
-
- 7,155 posts
Hopeless Addict
Posted 03 January 2016 - 05:47 PM
Oh, forgot to mention GOG specified only sea ice, not ice cap. Huge difference as the only ice cap in the northern hemisphere is the Greenland one (which retained 99.7% of its mass in the 20th century). Remember Antarctic ice cap is a couple thousand times as thick as sea ice.
Also, just happened across this. Thought it might help assuage GOG's fears. The IPCC, you know, the political "science" agency that advises politicians, had this to say about the economic impact of a 2 degree Celsius rise. In their opening statement in the Executive Summary of IPCC AR5 WGII Chapter 10 they say (bold theirs)
For most economic sectors, the impact of climate change will be small relative to the impacts of other drivers (medium evidence, high agreement). Changes in population, age, income, technology, relative prices, lifestyle, regulation, governance, and many other aspects of socioeconomic development will have an impact on the supply and demand of economic goods and services that is large relative to the impact of climate change. {10.10}
Sleep well my friend. 
"Of all tyrannies, a tyranny sincerely exercised for the good of its victims may be the most oppressive" -- C.S. Lewis
If the only way to combat "global warming" was to lower taxes, we would never hear of the issue again. - Anonymous
"Society in every state is a blessing, but Government, even in its best state, is but a necessary evil; in its worst state an intolerable one" — Thomas Paine, 𝘊𝘰𝘮𝘮𝘰𝘯 𝘚𝘦𝘯𝘴𝘦 (1776)
#86
Chris
-
- Premium Member
-
- 7,857 posts
Hopeless Addict
- Location:Folsom CA
Posted 03 January 2016 - 08:14 PM
Again, well said and presented Joe. I think I'm gonna ask Steve to change your name to "The Above Average Joe". I might change my name to "Climate Denier Chris"...... Kinda has a ring to it I think and just might strike terror into the hearts of my future Anthropogenic Global Warming believer adversaries....?  Regards, Chris
1A - 2A = -1A
#87
GrumpyOldGuy
-
- Premium Member
-
- 544 posts
Superstar
- Gender:Male
Posted 03 January 2016 - 09:09 PM
Joe - hilarious. the IPCC predicting economic activity??? double-hilarious. Economists can't even predict economic activity. They predicted seven of the last four recessions. My biggest concern is that reaction to warming is going to cost a lot of money. Look at the Mississippi Valley this week. Flooding in December is unprecedented. Gee...could it be related to w-a-r-m-I-n-g? It's going to cost $billions to repair. This money could be used for better purposes...like bribing politicians.
#88
The Average Joe
-
- Premium Member
-
- 7,155 posts
Hopeless Addict
Posted 03 January 2016 - 10:29 PM
I think it's about as hilarious as the IPCC predicting climate activity. But I thought you might enjoy it! This is the same group that said that although their climate models were not aligning with reality, their confidence in the model's projections INCREASED. Riddle me that one batman...
And again with the unprecedented. Maybe in our lifetimes. We have severely changed the natural flows of the river with levees. So yeah, maybe for the last 200 years, December flooding has not happened to the extent as now, but that valley has flooded throughout history with or without man there. Who is to say there weren't greater December floods? In 1735, New Orleans was flooded from Dec to June. 200 years is a blip on the geologic timeline. Heck, several thousand years ago, there were floods of biblical proportion, or so I am told.
"Of all tyrannies, a tyranny sincerely exercised for the good of its victims may be the most oppressive" -- C.S. Lewis
If the only way to combat "global warming" was to lower taxes, we would never hear of the issue again. - Anonymous
"Society in every state is a blessing, but Government, even in its best state, is but a necessary evil; in its worst state an intolerable one" — Thomas Paine, 𝘊𝘰𝘮𝘮𝘰𝘯 𝘚𝘦𝘯𝘴𝘦 (1776)
#89
Carl G
-

- Premium Member
-
- 1,674 posts
Hall Of Famer
- Gender:Male
Posted 04 January 2016 - 08:53 AM
....
Something evil is going on, to move all that ice from the top of the planet to the bottom and think we would not notice
....
Uh... I know you guys are scientist and all, but you seem to be missing the obvious. It is GRAVITY pulling it down. It is doing the same thing to me.
#90
The Average Joe
-
- Premium Member
-
- 7,155 posts
Hopeless Addict
Posted 04 January 2016 - 10:02 AM
Lol I'm no scientist, just and Average Joe, but that made me crack up. Thanks for that!
"Of all tyrannies, a tyranny sincerely exercised for the good of its victims may be the most oppressive" -- C.S. Lewis
If the only way to combat "global warming" was to lower taxes, we would never hear of the issue again. - Anonymous
"Society in every state is a blessing, but Government, even in its best state, is but a necessary evil; in its worst state an intolerable one" — Thomas Paine, 𝘊𝘰𝘮𝘮𝘰𝘯 𝘚𝘦𝘯𝘴𝘦 (1776)


2 user(s) are reading this topic
0 members, 2 guests, 0 anonymous users

