

Interesting indeed.
We have two people who are stuck in 2006 seething that Al Gore's movie got more attention than they did. We've got another person claiming that everything is normal and there's no need to worry.
And then we have a very large body of scientists who have another view. Think about it. Scientists, who spend their lives studying phenomena and trying to make sense of them, from a wide variety of disciplines (oceanography, meteorology, glaciology, climatology, atmospheric studies, polar studies, physics, thermodynamics, chemistry, et al) are all seeming to arrive at pretty much the same conclusions. Namely...humans burning fossil fuels, the combustion releasing green house gasses, and earth warming. Can all these scientists be wrong? A few amateurs in these forums thing so.
It's like if you have a math problem and one guys solves it with algebra, and another guy solves it with calculus, and a third guy solves it with quantum mechanics...and they all arrive at the same answer. Pretty certain that answer is correct.
Joe, sorry to see you go. You represented a rational position often. As for Chris and Aces, no explanation is available.


Climate Change & Sea Level Rise - Folsom Will Be Safe
Started by
GrumpyOldGuy
, Feb 25 2016 01:15 AM
climate change sea level warming
131 replies to this topic
#17

Chris
-

- Premium Member
-

- 7,857 posts
Hopeless Addict
- Location:Folsom CA
Posted 28 February 2016 - 09:01 AM
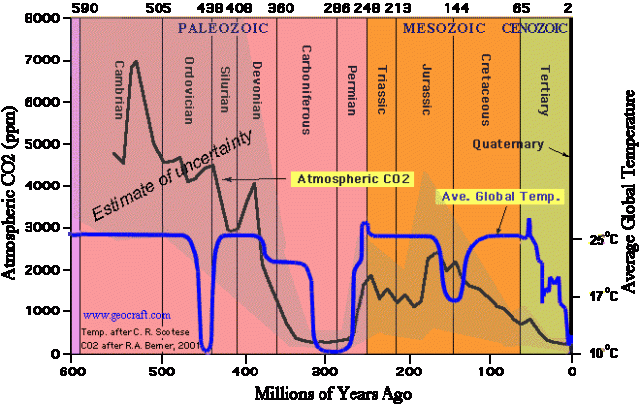
Again, you fail to address this chart and it's CO2 graph..... Your whole argument is about CO2 and man being the culprit. Just like in the other thread. You can't, you wont, you lose the argument again. Chris
50 million years ago, CO2 at about 500 ppm...
100 million years ago, CO2 at about 1800 ppm....
200 million years ago, CO2 at about 1500 ppm....
300 million years ago, CO2 at about 300 ppm....
400 million years ago, CO2 at about 3500 ppm...
500 million years ago, CO2 at about 4800 ppm....
1A - 2A = -1A
#18
apeman45
-

- Premium Member
-
- 191 posts
Veteran
- Gender:Male
Posted 28 February 2016 - 10:16 AM
Here is Joe's Arizona weather station known as Picacho 8 SE. It's a common ploy of deniers to find 1 piece of data to corrupt all data or as Joe calls it "garbage in garbage out". This particular station is not even used in the climate science equation. But it does make for some good propaganda that all climate science is bad. All the denier sites are all over this particular weather station and stating it as proof positive that all climate science is garbage.
http://blog.hotwhopp...ed-deniers.html
#19
Chris
-
- Premium Member
-
- 7,857 posts
Hopeless Addict
- Location:Folsom CA
Posted 28 February 2016 - 01:20 PM
Here is Joe's Arizona weather station known as Picacho 8 SE. It's a common ploy of deniers to find 1 piece of data to corrupt all data or as Joe calls it "garbage in garbage out". This particular station is not even used in the climate science equation. But it does make for some good propaganda that all climate science is bad. All the denier sites are all over this particular weather station and stating it as proof positive that all climate science is garbage.
Speaking about "deniers" address the CO2 chart above for us. You two (GoG and you) never seem to notice it...? I've only posted it a dozen times in hopes that you'll open your eyes and question this stupid political agenda of yours disguised as "science". Chris
1A - 2A = -1A
#20
The Average Joe
-

- Premium Member
-
- 7,155 posts
Hopeless Addict
Posted 28 February 2016 - 03:16 PM
Here is Joe's Arizona weather station known as Picacho 8 SE. This particular station is NO LONGER IN USE not even used in the climate science equation.
Fixed that for you. It was indeed used, as well as many others with similar issues.
I must respond of course.
A smattering of others in the west:
http://www.surfacest...g/odd_sites.htm
Less than 8% of the reporting sites are considered tier 1 or 2 (best) with errors less than 1 degree C (which is itself a huge error bar considering you are claiming change in the tenths of a degree).
http://www.surfacestations.org/
USHCN or USClimDiv makes no difference. The methodology for getting the raw data is in question. While how you INTERPRET AND ADJUST raw data has a HUGE impact on your outcome, faulty raw data ruins the outcome before you even start. I stand my my claim.
"Of all tyrannies, a tyranny sincerely exercised for the good of its victims may be the most oppressive" -- C.S. Lewis
If the only way to combat "global warming" was to lower taxes, we would never hear of the issue again. - Anonymous
"Society in every state is a blessing, but Government, even in its best state, is but a necessary evil; in its worst state an intolerable one" — Thomas Paine, 𝘊𝘰𝘮𝘮𝘰𝘯 𝘚𝘦𝘯𝘴𝘦 (1776)
#21
Chris
-
- Premium Member
-
- 7,857 posts
Hopeless Addict
- Location:Folsom CA
Posted 28 February 2016 - 03:49 PM
Joe, they won't see it, won't acknowledge it.... Does not fit their political theory disguised as a "science" problem. They will just go on with their agenda, repeating nonsense and junk, biased science. Funny how funding now a days corrupts real science...? It's big business actually. A lot of money to be made if you tow the line on APGW....
Chris
1A - 2A = -1A
#22
GrumpyOldGuy
-
- Premium Member
-
- 544 posts
Superstar
- Gender:Male
Posted 28 February 2016 - 03:49 PM
Chris, OK. I will entertain the graph you've posted so many times. It actually illustrates my point quite well.
First, the issue - The phenomenon that has everyone concerned is not the absolute levels of CO2 in the atmosphere. No one is challenging that data. The issue that concerns scientists is the rate at which the CO2 level is rising. I've tried to explain this before to you.
So, lets look at the data that is on the graph that you posted. The period with the highest rate of CO2 increase is between 190 and 180 million years ago...a period of about 10 million years. During that time the CO2 level rose from 1200 ppm to 2100 ppm. This calculates to a CO2 concentration increase of 0.09 ppm per century during that period of time.
Lets look at the CO2 rate of increase right today (Keeling curve). Between 1960 and 2010, CO2 concentration increased from 315 ppm to 385 ppm. This calculates to a CO2 concentration increase of 140 ppm per century.
So, the rate of CO2 concentration increase today is over 1500 times the rate it ever was in history of the planet (according to your graph). Unprecedented by any measure.
Why is everyone worried about this (or should be)? 185 million years ago, the effects of the concentration change were spread over millions of years, so flora and fauna were able to adjust to the changes gradually over time. Evolution at work. Today, the effects of change are substantially accelerated and flora, fauna, and societies will not be able to adjust over this highly shortened period of a couple centuries. It is going to lead to serious financial and social problems that no one is preparing for. We are just starting to see the leading edge of these problems today...weather extremes, tidal flooding, disappearing glaciers, rising sea levels, droughts, etc.
Fasten your seatbelt. Gonna be a bumpy ride.
I've simplified the evaluation to make it easier to understand by not doing a % of absolute value calculation and ignoring the trend from the Keeling Curve that shows the rate of CO2 increase is actually accelerating. Once the basics are mastered, we can get to the fine points.
#23
Chris
-
- Premium Member
-
- 7,857 posts
Hopeless Addict
- Location:Folsom CA
Posted 28 February 2016 - 04:24 PM
Chris, OK. I will entertain the graph you've posted so many times. It actually illustrates my point quite well.
First, the issue - The phenomenon that has everyone concerned is not the absolute levels of CO2 in the atmosphere. No one is challenging that data. The issue that concerns scientists is the rate at which the CO2 level is rising. I've tried to explain this before to you.
So, lets look at the data that is on the graph that you posted. The period with the highest rate of CO2 increase is between 190 and 180 million years ago...a period of about 10 million years. During that time the CO2 level rose from 1200 ppm to 2100 ppm. This calculates to a CO2 concentration increase of 0.09 ppm per century during that period of time.
Lets look at the CO2 rate of increase right today (Keeling curve). Between 1960 and 2010, CO2 concentration increased from 315 ppm to 385 ppm. This calculates to a CO2 concentration increase of 140 ppm per century.
So, the rate of CO2 concentration increase today is over 1500 times the rate it ever was in history of the planet (according to your graph). Unprecedented by any measure.
Why is everyone worried about this (or should be)? 185 million years ago, the effects of the concentration change were spread over millions of years, so flora and fauna were able to adjust to the changes gradually over time. Evolution at work. Today, the effects of change are substantially accelerated and flora, fauna, and societies will not be able to adjust over this highly shortened period of a couple centuries. It is going to lead to serious financial and social problems that no one is preparing for. We are just starting to see the leading edge of these problems today...weather extremes, tidal flooding, disappearing glaciers, rising sea levels, droughts, etc.
Fasten your seatbelt. Gonna be a bumpy ride.
I've simplified the evaluation to make it easier to understand by not doing a % of absolute value calculation and ignoring the trend from the Keeling Curve that shows the rate of CO2 increase is actually accelerating. Once the basics are mastered, we can get to the fine points.
Not so fast there Sparky.... You are using bogus manipulated numbers and data and changing the argument to the "rate of increase". All over a very short time. Admit it, you are at a loss when you look at the chart I provide. You can't explain it away with smoke and mirrors and changing the argument to "rate of increase" which your side so tries to manipulate and "massage" with your funny math. Glad that at least you took a shot at it....! What took you so long....? That chart does blow your whole argument out of the water. How cool is that...! Chris
1A - 2A = -1A
#24
GrumpyOldGuy
-
- Premium Member
-
- 544 posts
Superstar
- Gender:Male
Posted 28 February 2016 - 05:42 PM
Chris, you are hilarious. Now you are telling me the numbers from the chart you provided are bogus. Ok!
Folks, we can't make this stuff up.
Chris, my point ALL ALONG has been the "rate of change" issue. Go back and look at my original posts in the other forum. Please count how many times I use the phrase "rate of change". Nothing in my argument has changed.
You didn't get it then, and you don't get it now. You will become a member of that ever receding pocket of scientific ignorance. Sorry to see that.
#25
apeman45
-
- Premium Member
-
- 191 posts
Veteran
- Gender:Male
Posted 28 February 2016 - 05:51 PM
Grumpy Old Guy - Your mistake is using science and math to explain things to Chris.
#26
GrumpyOldGuy
-
- Premium Member
-
- 544 posts
Superstar
- Gender:Male
Posted 28 February 2016 - 06:36 PM
Apeman - I try to make it simple, but sometimes it doesn't work.
Chris - just for reference...looking back at the previous forum we had on climate change, I talked about "rate of change" thirteen times. My position hasn't changed.
If you don't believe it, please check it out.
#27
GrumpyOldGuy
-
- Premium Member
-
- 544 posts
Superstar
- Gender:Male
Posted 29 February 2016 - 12:23 AM
Joe, You cite some weather station where there are any number of possible error sources. In the world of sensors (including temperature sensors) error sources abound. In fact, it's impossible to completely eliminate all errors in any sensor application. Errors can be managed in any number of ways. One way in certain types of evaluations is to simply ignore the errors. Sounds nutty, but is commonly done, and the resulting data is still quite valid.
In the example you cited, lets just say that because of thermal effects of a nearby masonry wall, the temperature measurement is off by 2 degrees. Because the sensor and the wall haven't been altered since the day they were installed, the temperature measurement has always had the 2 degree error. This is knows as a low accuracy, high precision sensor (know the difference between accuracy, precision, and resolution). Data from sensors like this can be very useful when tracking trends, shifts, anomalies, outliers, skews, and drift. And climate studies are mostly looking at trends and changes. So data from a sensor like this could be very useful, particularly when looking at long term trends. In this case, you don't need to know if the temperature is exactly 68 degrees right now, but you do need to know how the temperature has changed from last year at this time. The only parameter that needs to be accurate in this type of application is span calibration.
#28
nomad
-

- Premium Member
-
- 2,548 posts
Living Legend
Posted 29 February 2016 - 07:45 AM
You guys should all get a room with Leo DeCaprio.
#29
2 Aces
-

- Premium Member
-
- 11,403 posts
Hopeless Addict
- Gender:Male
- Location:Folsom
Posted 29 February 2016 - 08:09 AM
You guys should all get a room with Leo DeCaprio.
DeCaprio brings a special level of STUPID if he believes that global warming or climate change is the most dangerous thing the world faces...same with anyone who shares his belief. Is the *Left* getting dumber by the day ??
Also, you'd think that Chris and Joe would realize that they are being trolled by *professional trolls* who came to this forum from Facebook.
Maybe one of these days they'll figure it out and let the panic-stricken global warming fanatics/trolls die in silence !! 
#30
The Average Joe
-
- Premium Member
-
- 7,155 posts
Hopeless Addict
Posted 29 February 2016 - 09:14 AM
In the example you cited, lets just say that because of thermal effects of a nearby masonry wall, the temperature measurement is off by 2 degrees. Because the sensor and the wall haven't been altered since the day they were installed, the temperature measurement has always had the 2 degree error.
You had to pull me back in didn't you?  And that is where your argument is invalid. Most of the long term sites have had encroachment of measurement altering items during their lifetime. That brick wall was not always there. Think about it. Only a moron would site a temperature sensor in those conditions.That 2 degree error has not always been a 2 degree error. You have sensors at airports (hot exhaust and asphalt) or firestations (asphalt, heat exchangers, brick), or just placed on what used to be a rural country field that are now surrounded with urban growth. That is why only 8% of the sites have less than 1 degree of error. As one who likes to run the numbers, doesn't it bother you that over 90% of the measurement sites are known to have greater than 1% errors?
That doesn't even begin to account for the switch from analog to digital measurement devices, or their movement from one location to another. How about the fact that the measurement of the US temperatures is done by 6000 or so station that must cover 3.8 million square miles. That is an average of 666 square mile per sensor. There is a lot of temperature variability in a area 26 miles square. That is why siting becomes an even bigger variable and why it is important when using a few station to infill missing data. Worldwide the situation is even worse. Seriously, there are so many issues with getting the raw data that for anyone to argue that they know what the "global average" temperature is to a tenth of a percent is ludicrous.
As to your rate of change argument. Yes, i agree. CO2 is rising rapidly. My reply is so what? Even If you doubled the CO2, you would go from 0.04% to 0.08%. Plants would love it! Also, once again we must talk about siting. The basis for most claims of extreme rise in CO2 come from where? Mauna Loa. Now where does the wind approaching Mauna Loa come from? That would be mainland China. Who has exponentially increased their CO2 production (and continues to do so)? It's like standing downwind of a campfire in the middle of the forest and saying, "Gee, this forest sure is smoky." Here is the siting map for the "global" monitoring of CO2 (yellow are inactive). Notice anything odd? http://www.esrl.noaa.../ccgg/flask.php
And lastly, there is no definitive link between CO2 and climate change. It is a theory that falls pretty flat the deeper you dig.
"Of all tyrannies, a tyranny sincerely exercised for the good of its victims may be the most oppressive" -- C.S. Lewis
If the only way to combat "global warming" was to lower taxes, we would never hear of the issue again. - Anonymous
"Society in every state is a blessing, but Government, even in its best state, is but a necessary evil; in its worst state an intolerable one" — Thomas Paine, 𝘊𝘰𝘮𝘮𝘰𝘯 𝘚𝘦𝘯𝘴𝘦 (1776)


Also tagged with one or more of these keywords: climate, change, sea level, warming
Main Forums →
State / US / World Government & Politics →
Latest Data - Global Warming - Getting HotterStarted by GrumpyOldGuy , 19 May 2016 |
|
|
||
Main Forums →
Open Topic →
Messing With Our Planet Part I - Warmest February Ever RecordedStarted by GrumpyOldGuy , 18 Mar 2016 |
|
|
1 user(s) are reading this topic
0 members, 1 guests, 0 anonymous users

